To upload csv data as ADP(Array data provider) or array

Steps to upload csv data as ADP(Array data provider) or array

  • Add a file component
  • On file select call the below JavaScript function and pass file as parameter
  • Assign the result from below function to ADP.data or Array

JavaScript function

PageModule.prototype.getRowsFromCsv = function (file) {
  return new Promise((resolve) => {
    try {
      let fileContent = [];
      const fileReader = new FileReader();
      fileReader.readAsText(file);
      fileReader.onload = (e) => {
        let result = e.target.result;
        let columns = ['employee','name','phone','salary'];
        let size;
        let inputData = [];
        if (result) {
          let lines = result.split("\n");
          for ( let  i = 1 ; i < lines.length ; i++ ) {
            let row = lines[i];
            let rowArray = row.split(",");
            let inputObj = {} ;
            inputObj.employee = rowArray[0];
            inputObj.name = rowArray[1];
            inputObj.phone = rowArray[2];
            inputObj.salary= rowArray[3];
            inputData.push(inputObj);
          }
          resolve({
            success: true,
            inputData: inputData,
            error: ""
          });
        } else {
          resolve({
            success: false,
            inputData: [],
            error: "Empty File : " + result
          });
        }
      };
    } catch (err) {
      resolve({
        success: false,
        inputData: [],
        error: "Error while reading file : " + err.detail
      });
    }
  });
};

Sample CSV data that will work with this code

employee,name,phone,salary
1,khalil,123,3000
2,ahmed,345,4000
3,sayeed,929,25000

Sample file picker html code

<div class="oj-sm-padding-0 oj-md-padding-4x">
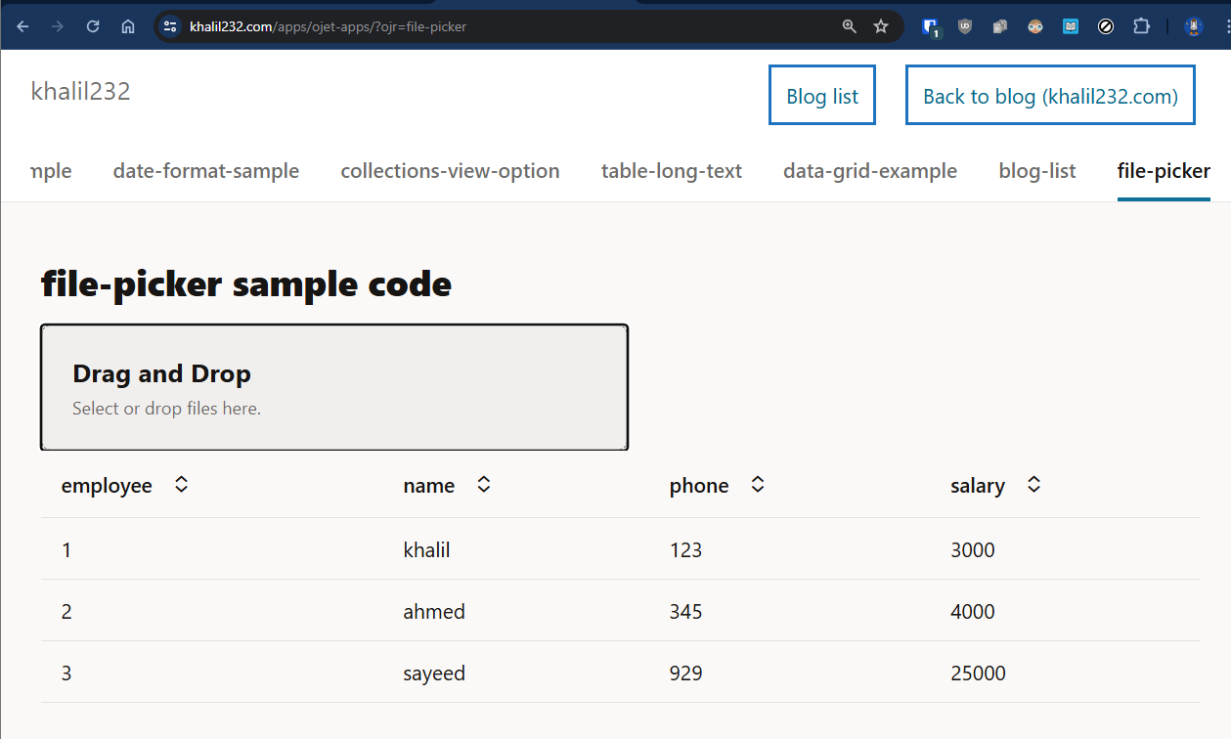
    <h4>file-picker sample code</h4>

    <oj-file-picker on-oj-select="[[ fileSelectListener ]]">

    </oj-file-picker>


    <oj-table class="custom-table" id="employeetable" scroll-policy="loadMoreOnScroll"
        class="oj-flex-item oj-sm-12 oj-md-12" data="[[ employeeADP ]]" columns='[
    {"headerText":"employee","field":"employee"},
    {"headerText":"name","field":"name"},
    {"headerText":"phone","field":"phone"},
    {"headerText":"salary","field":"salary"}
    ]'>
    </oj-table>

</div>

Sample working code — iframe

Link to live demo — file-picker

Format dates in VBCS page using functions

You can use oj-input-date or oj-input-date-time components for showing formatted date and use convertor options

But when using above component only for read-only purpose to show some values in grid or table, it doesn’t make sense to use input fields.

Instead we can use oj-bind-text field and pass data using following JavaScript function.

The JavaScript function will add necessary formatting to the date and return the value as string.

Live code preview

We can use date convertor functions to format the date in required format

JavaScript function

define(["ojs/ojconverter-datetime"], (datetimeConverter) => {
  "use strict";

  class PageModule {
    convertDateToStr(customDate) {
        let dateConvertor = new datetimeConverter.IntlDateTimeConverter({
          pattern: "dd-MMM-yyyy",
        });
      return dateConvertor.format(customDate);
    }
  }

  return PageModule;
});

Patterns examples

Patterns Input – date stringOutput – formatted date
dd-MMM-yyyy2024-01-18T13:59:23+05:3018-Jan-2024
dd-MM-yyyy2024-01-18T13:59:23+05:3018-01-2024
MM/dd/yyyy2024-01-18T13:59:23+05:3001/18/2024
MM/dd/yyyy hh:mm:ss2024-01-18T13:59:23+05:3001/18/2024 01:59:23
MM/dd/yyyy hh:mm:ss a2024-01-18T13:59:23+05:3001/18/2024 01:59:23 PM

References –

jsDoc for IntlDateTimeConverter ( to view all convertor options )

https://www.oracle.com/webfolder/technetwork/jet/jsdocs/oj.IntlDateTimeConverter.html

Live application URL ( to try out few configs )

https://khalil232.com/apps/ojet-apps/?ojr=date-format-sample

How to have different colors on rows based on one field in row in oj-data-grid

On a data grid, we can use a function in the cell.class-name attribute to dynamically pass the class name based on row data.

cellContext” will contain the required information. We can use console.log() to identify the structure.

This can be used for other attributes, like “header.column.class-name” as well on oj-data-grid

This can be used when we want show different style for different rows, like

  • If we want to highlight top performer in a data set,
  • or differently show calculated fields
  • or if we want to show different type with a different color

Sample HTML code:

<div class="oj-flex">
  <div class="oj-flex-item oj-sm-12 ">
    <h5>Data grid</h5>
    <oj-data-grid id="datagrid" style="width:100%;height:400px" aria-label="My Data Grid" 
      data='{{ salaryDataADP }}'
      header.column.style="[[ headerColStyle ]]" header.column.resizable.width="enable"
      header.column.resizable.height="enable" header.row.resizable.width="enable"     
      header.row.resizable.height="enable"
      header.column.class-name="oj-helper-justify-content-flex-start" 
      cell.class-name="[[ cellClassNameFunc ]]"
      cell.style="width: 200px;">     
    </oj-data-grid>
  </div>
</div>

Sample JS code:

this.cellClassNameFunc = function (cellContext) {
  let cellRowIndex = cellContext.indexes.row;
  let classNameStr = "oj-helper-justify-content ";
  
  // to do styling based on index 
  // if (cellRowIndex % 3 === 0) {
  //   classNameStr += "oj-bg-success-10 oj-text-color-success";
  // } else if (cellRowIndex % 3 === 1) {
  //   classNameStr += "oj-bg-danger-30	 oj-text-color-danger";
  // } else {
  //   classNameStr += "oj-bg-warning-30 oj-text-color-warning";
  // }
  
  let key = cellContext.key;
  console.log(cellContext);
  console.log(cellContext.datasource.data[cellRowIndex]);
  let rowData = cellContext.datasource.data.find((x) => x.id === key);
  if (rowData.city === "Delhi" || rowData.city === "Banglore") {
    classNameStr += "oj-bg-success-10 oj-text-color-success";
  } else if (rowData.city === "Hyderabad" || rowData.city === "Kolkata") {
    classNameStr += "oj-bg-danger-30	 oj-text-color-danger";
  } else if (rowData.city === "Mumbai" || rowData.city === "Nagpur") {
    classNameStr += "oj-bg-warning-30 oj-text-color-warning";
  }
  
  cellContext.datasource[cellRowIndex];
  
  return classNameStr;
};

Screenshots

Choosing row background color and text color based on city

Choosing row background color and text color based on index

Live application URL ( row style based on city ): https://khalil232.com/apps/ojet-apps/?ojr=data-grid-example

References:

Datagrid js doc for identifying other attributes : https://www.oracle.com/webfolder/technetwork/jet/jsdocs/oj.ojDataGrid.html

CSS helpers used:

Background-color: https://www.oracle.com/webfolder/technetwork/jet/jsdocs/BackgroundColor.html

Font color: https://www.oracle.com/webfolder/technetwork/jet/jsdocs/Text.html

How to enable resize in oj-data-grid

We can enable resize in oj-data-grid by adding the following html code to <oj-data-grid>:

<oj-data-grid
  id="datagrid"
  style="width:100%;height:400px"
  aria-label="My Data Grid"
  data='{{ salaryDataADP }}'
  header.column.style="[[ headerColStyle ]]"
  header.column.resizable.width="enable"
  header.column.resizable.height="enable"
  header.row.resizable.width="enable"
  header.row.resizable.height="enable"
  header.column.class-name="oj-helper-justify-content-flex-start"
  cell.class-name="oj-helper-justify-content-flex-start"
>
  <oj-menu slot="contextMenu" aria-label="Employee Edit">
    <oj-option id="resizeWidth" value="Resize Width"
      data-oj-command="oj-datagrid-resizeWidth"></oj-option>
    <oj-option id="resizeHeight" value="Resize Height"
      data-oj-command="oj-datagrid-resizeHeight"></oj-option>
    <oj-option id="resizeFitToContent" value="Resize Fit To Content"
      data-oj-command="oj-datagrid-resizeFitToContent"></oj-option>
  </oj-menu>
</oj-data-grid>

The following attributes on the header will allow resizing. When hovering on a border, the user can resize the row or column height or width.

<oj-data-grid
  header.column.resizable.width="enable"
  header.column.resizable.height="enable"
  header.row.resizable.width="enable"
  header.row.resizable.height="enable"
>
</oj-data-grid>

To add an additional right-click menu, we can add the below code. The user can right-click and click on Resize width, and enter a desired width, like 100 or 200.

<oj-menu slot="contextMenu" aria-label="Employee Edit">
    <oj-option id="resizeWidth" value="Resize Width"
      data-oj-command="oj-datagrid-resizeWidth"></oj-option>
    <oj-option id="resizeHeight" value="Resize Height"
      data-oj-command="oj-datagrid-resizeHeight"></oj-option>
    <oj-option id="resizeFitToContent" value="Resize Fit To Content"
      data-oj-command="oj-datagrid-resizeFitToContent"></oj-option>
  </oj-menu>

There are other commands available, like below ( see the jsdoc link for more information ). Few features are supported only in latest version of JET

Default Functiondata-oj-command value
Resize menu (contains width and height resize)oj-datagrid-resize
Sort Row menu (contains ascending and descending sort)oj-datagrid-sortRow
Sort Column menu (contains ascending and descending sort)oj-datagrid-sortCol
Resize Widthoj-datagrid-resizeWidth
Resize Heightoj-datagrid-resizeHeight
Resize Fit To Contentoj-datagrid-resizeFitToContent
Sort Row Ascendingoj-datagrid-sortRowAsc
Sort Row Descendingoj-datagrid-sortRowDsc
Sort Column Ascendingoj-datagrid-sortColAsc
Sort Column Descendingoj-datagrid-sortColDsc
Cut (for reordering)oj-datagrid-cut
Paste (for reordering)oj-datagrid-paste
CutCells (for data transferring)oj-datagrid-cutCells
CopyCells (for data transferring)oj-datagrid-copyCells
PasteCells (for data transferring)oj-datagrid-pasteCells
Filloj-datagrid-fillCells
Select Multiple Cells on Touch Deviceoj-datagrid-discontiguousSelection
Freeze Columnsoj-datagrid-freezeCol
Freeze Rowsoj-datagrid-freezeRow
Unfreeze Columnsoj-datagrid-unfreezeColumn
Unfreeze Rowsoj-datagrid-unfreezeRow
Hide Columnsoj-datagrid-hideCol
Unhide Columnsoj-datagrid-unhideCol

Screenshots

Live application URL: https://khalil232.com/apps/ojet-apps/?ojr=data-grid-example

References:

helper classes: https://www.oracle.com/webfolder/technetwork/jet/jsdocs/Helpers.html

jet cookbook: https://www.oracle.com/webfolder/technetwork/jet/jetCookbook.html?component=dataGrid&demo=resizing

link for oj-data-commands: https://www.oracle.com/webfolder/technetwork/jet/jsdocs/oj.ojDataGrid.html#contextmenu-section

How to refresh particular cell in oj-data-grid

We can use the update event to refresh particular grid cells.

Let us say we are displaying a grid with few rows where the user can edit the data and we are showing few calculated fields (like total or percentage). If we have to refresh the grid cells after updating the cell with the correct value, we can use the following JavaScript code:

// "gridData" is a variable holding grid information. 
// We can pass "gridData" to the JS function and call the below code.

let updateEventDetails = {
"type": "update",
"detail": {
    "ranges": [{
            "rowOffset": 0,      // start of grid row
            "columnOffset": 0,   // start of grid col
            "rowCount":  gridData.counts.row // end of grid row
            "columnCount": gridData.counts.column // end of grid col 
       }]
    }
};
gridData.dispatchEvent(updateEventDetails);

The above code will refresh all the grid cells; if we want to refresh only a particular grid cell, we can set relative rowOffset, columnOffset, rowCount or columnCount.

We can also give multiple ranges if the cells cannot be captured in a single range.

When we use the refresh event on the grid, the grid becomes white and renders again. In order to avoid that, we use the update event. The update event doesn’t remove the focus, and only the cells in range will get refreshed.

If you have a huge amount of data in the grid, use the update event very rarely. It has a huge impact on performance. If you want a large number of cells to be refreshed, use the refresh event instead of the update event.

References:

Data Grid Cookbook: https://www.oracle.com/webfolder/technetwork/jet/jetCookbook.html?component=dataGrid&demo=overView

ojDataGrid JS doc: https://www.oracle.com/webfolder/technetwork/jet/jsdocs/oj.ojDataGrid.html

DataGridProviderUpdateEvent: https://www.oracle.com/webfolder/technetwork/jet/jsdocs/DataGridProviderUpdateEvent.html

Calling Rest API using JavaScript function in vbcs

We can call rest API configured in service connection using RestHelper

The function getLineItems() can be called using action chain.

define(["vb/helpers/rest"], (Rest) => {
  "use strict";

  class PageModule {
    getLineItems() {
      let endpointurl = "buinessObjects/getalls_Country";
      let queryString = "id is not null";

      return new Promise(function (resolve, reject) {
        var ep = Rest.get(endpointurl);
        ep.parameters({
          q: queryString,
          onlyData: true,
          limit: 50,
          orderBy: "id:asc",
        });
        ep.fetch().then(function (result) {
          if (result.response.ok) {
            resolve(result.body.items);
          } else {
            resolve([]);
          }
        });
      });
    }
  }

  return PageModule;
});

We can call the rest API configured in the service connection using Rest Helper in APP UI as well

We have to additional pass extensionId – site_MyExtension. ( id of the APP UI extension.

You can find the extension id from ->

  • Open workspace, click on extension name in left hand side
  • Go to settings and you will find extension id.
define(["vb/helpers/rest"], (Rest) => {
  "use strict";

  class PageModule {
    getLineItems() {
      let extensionId = "site_MyExtension"
    
      let endpointurl = "site_MyExtension:saasRestApi/getalls_Country";
      let queryString = "id is not null";
 
      return new Promise(function (resolve, reject) {
        var ep = Rest.get(endpointurl, { extensionId: "site_MyExtension" } );
        ep.parameters({
          q: queryString,
          onlyData: true,
          limit: 50,
          orderBy: "id:asc",
        });
        ep.fetch().then(function (result) {
          if (result.response.ok) {
            resolve(result.body.items);
          } else {
            resolve([]);
          }
        });
      });
    }
  }

  return PageModule;
});

How to handle large text in table or grid

By default long text in table or data-grid will expand, showing all text in single line, that may not be very useful.

Columns will get expanded and few columns which we want to show will be hidden.

<oj-table class="custom-table" 
  id="employeetable"
  scroll-policy="loadMoreOnScroll" 
  class="oj-flex-item oj-sm-12 oj-md-12"
  data="[[ employeeListADP ]]" 
  columns='[
            {"headerText":"Id","field":"id"},
            {"headerText":"Employee Number","field":"empNumber"},
            {"headerText":"Employee Name","field":"empName"},
            {"headerText":"Department Name","field":"departmentNumber"},
            {"headerText":"Address","field":"address"},
            {"headerText":"Address line","field":"addressLine2"}
        ]'>
  </oj-table>

We can set for the column, so that it doesn’t expand.

e.g.: In this for Address we can give max-width as 200px

This will show the text up to 200px and later it is show as … This is similar to text-overflow: ellipsis; css code

<oj-table class="custom-table" 
    id="employeetable"
    scroll-policy="loadMoreOnScroll"
    class="oj-flex-item oj-sm-12 oj-md-12"
    data="[[ employeeListADP ]]" 
    columns='[
      {"headerText":"Id","field":"id"},
      {"headerText":"Employee Number","field":"empNumber"},
      {"headerText":"Employee Name","field":"empName"},
      {"headerText":"Department Name","field":"departmentNumber"},
      {"headerText":"Address","field":"address","style": "max-width:200px"},
      {"headerText":"Address line","field":"addressLine2"}
    ]'>
</oj-table>

We can try to wrap the text using oj-helper-overflow-wrap-anywhere oj-helper-white-space-normal classes

<h5>Table with added width to Address column</h5>
<oj-table class="custom-table"  
    id="employeetable"  
    scroll-policy="loadMoreOnScroll" 
    class="oj-flex-item oj-sm-12 oj-md-12"
    data="[[ employeeListADP ]]" 
    columns='[
        {"headerText":"Id","field":"id"},
        {"headerText":"Employee Number","field":"empNumber"},
        {"headerText":"Employee Name","field":"empName"},
        {"headerText":"Department Name","field":"departmentNumber"},
        {  
            "headerText":"Address",
            "field":"address",
            "className": "oj-helper-overflow-wrap-anywhere oj-helper-white-space-normal"
        },
        {"headerText":"Address line","field":"addressLine2"}
    ]'>
</oj-table>

Link to live application – https://khalil232.com/apps/ojet-apps/?ojr=table-long-text

Link for text-overflow: ellipsishttps://developer.mozilla.org/en-US/docs/Web/CSS/text-overflow

Link for oradocs for content wrap – https://www.oracle.com/webfolder/technetwork/jet/jetCookbook.html?component=table&demo=columnContentWrapping

When to use grid or table or for each in VBCS

While showing collections, we can use oj-table or oj-data-grid or we can use oj-for-each to display multiple values

When we show some data which comes in API, and we don’t have to much grouping and all we can show as table

If the data has few actions like approve or to update few columns like Quantity or Price or has some links to open in a page to view some more data or link to download some data we can use table

When we want to have a screen with large amount of data, where user will add multiple rows, edit like a excel instead of table we can use data grid. Data grid has better edit support than editable table. It is easy to handle edit events on data grid.

If we want to show summary based on some columns, like we are showing crick players information like number of sixes or total number of runs scored or total wickets taken per team, we can have player records and team records to show total. This will be better achieved with grid.

If we want to show People like data with images or some products like shirts, cars or something else where having a different look and feel, than table helps.

We can also provide option to change the view from table to grid to for-each

e.g.:

live link – https://khalil232.com/apps/ojet-apps/?ojr=collections-view-option

Format number in VBCS page using functions

You can use oj-input-number tag for showing formatted number and use convertor options

But when using above component only for read-only purpose to show some values in grid or table, it doesn’t make sense to use input fields.

Instead we can use oj-bind-text field and pass data using following javascript function.

The JavaScript function will add necessary formatting to the number and return the value as string.

We can use number convertor functions to format the number in required format

Live code preview

JavaScript function

define(["ojs/ojconverter-number"], (numberConverter) => {
  "use strict";

  class PageModule {
    convertNumberToStr(amount) {
      var numberConvertor = new numberConverter.IntlNumberConverter({
        maximumFractionDigits: 2,
        useGrouping: true,
        currency: "USD",
        currencyDisplay: "symbol",
        style: "currency",
      });

      return numberConvertor.format(amount.rate);
    }
  }

  return PageModule;
});

Config options

Field nameField valueInputOutput
maximumFractionDigits 224599.44249424599.44
024599.44249424599
useGrouping true 1232459912,324,599
false 1232459912324599
currency USD12324599$12,324,599.00
INR12324599₹12,324,599.00
EUR12324599€12,324,599.00
currencyDisplay symbol12324599USD 12,324,599
code 12324599$12,324,599
name 1232459912,324,599 US Dollar
style percent 0.769576.95%
currency 12324599$12,324,599.38
decimal 12324599.383812324599.38

Commonly used config options

to show currency amount like $12,324,599.38 or €12,324,599.38

{
  "maximumFractionDigits": 2,
  "useGrouping": true,
  "currency": "USD",
  "currencyDisplay": "symbol",
  "style": "currency",
}

to show percentage like 60% or 80.4%

{
  "maximumFractionDigits": 2,
  "useGrouping": false,
  "style": "percent",
}

to show whole number values

{
  "maximumFractionDigits": 0,
  "useGrouping": true,
  "style": "decimal"
}

References –

oj-input-number convertor related code

https://www.oracle.com/webfolder/technetwork/jet/jetCookbook.html?component=inputNumber&demo=inputNumberConverter#

jsDoc for IntlNumberConverter ( to view all convertor options like useGrouping, currency )

https://www.oracle.com/webfolder/technetwork/jet/jsdocs/oj.IntlNumberConverter.html

Live application URL ( to try out few configs )

https://khalil232.com/apps/ojet-apps/?ojr=number-format-sample

How to make scroll bar thicker in vbcs table or gird

Update 01-Feb-2025 02:54 AM use this code instead

#employeetable > * {
  scrollbar-width: auto;
}

Based on the default redwood theme the table and grid scoll bar are very thin

User can update it by adding the following code in app.css in vbcs application.

#employeetable::-webkit-scrollbar-track {
  border-radius: 15px;
  background-color: #e9e9e9;
  border-radius: 15px;
}

#employeetable ::-webkit-scrollbar {
  width: 15px;
  height: 15px;
  background-color: #e9e9e9;
  border-radius: 15px;
}
#employeetable ::-webkit-scrollbar-thumb {
  width: 15px;
  height: 15px;
  border-radius: 15px;
  background-color: #7b7d7f;
}

width will increase the thickness of vertical scroll bar

height will increase the thickness of horizontal scroll bar.

Screenshot without additional css

Screenshot with additional css

Live application example ( hover on the application to view scroll bar ) :

Link to view application in new tab – https://khalil232.com/apps/ojet-apps/?ojr=thick-scrollbar